English
 Views: 0 Author: Elsa Long Publish Time: 2026-10-15 Origin: Site


Between the moment a stencil printer finishes its stroke and the moment a board enters reflow, there is exactly one opportunity to catch a printing problem while it is still cheap: post-print solder paste inspection. An I.C.T solder paste printer product hub catalog will tell you what a printer can deposit, but it is the SPI machine sitting next to it on the line that tells you what was actually deposited — and the distance between those two facts is where most print yield is won or lost. Treated as separate purchases, a printer and an SPI machine are an inspector and a suspect; treated as one system, they are the most effective process-control pairing on the SMT line.
This guide explains how SMT stencil printer and SPI integration works in practice: what the inspection actually measures, which of those measurements the printer can act on automatically, how to correlate inspection data with print parameters without chasing noise, how statistical process control turns thousands of deposits into a handful of decisions, and what the loop cannot fix. It closes with a phased implementation sequence you can apply to an existing line.
Table of Contents
The cheapest defect on an SMT line is the one caught before reflow. A solder paste deposit that is short, shifted, slumped or bridging costs seconds to reject at the printer's exit; the same fault reflowed into a joint costs a rework cycle, an operator's judgment call, and in the worst cases a board that ships with a latent weakness. Roughly speaking, the majority of solder-related defects in volume production trace back to the printing step, which is why the industry responded by putting a measurement machine immediately after the printer and wiring the two together. That pairing — an SMT stencil printer and SPI integration — is not an optional premium anymore; on any line running fine pitch, high volume, or both, it is the backbone of print process control.
This section sets out why the loop matters economically and operationally. It walks through how defect cost escalates stage by stage, the two distinct questions a print process must answer on every board, and where SPI sits as the printer's quality gate. The aim is a working justification you can carry into a capital meeting: the inspection is not there to photograph paste, it is there to close a control loop that no operator, however attentive, can close by eye at line rate.
Follow one defective deposit through the line and the economics explain themselves. At the print stage, the fault is measured in microns and milliseconds: an insufficient deposit on one pad of a 0402, caught by SPI, costs a rejection or an automated discard before any value is added. Send the same board through reflow and the insufficient deposit becomes an open joint or a weak, grainy fillet; the fault now hides inside an assembled assembly, and finding it means AOI at best, functional test at worst, and rework — with its own touch, heat and risk — almost certainly.
The escalation is not linear, it is multiplicative. A paste bridge between two fine-pitch leads reflows into a solder short that may pass electrical test initially and fail in the field, because a marginal bridge can be both electrically conductive and mechanically fragile. Each stage the defect travels adds diagnosis time, materials, and the possibility that the repair itself damages the board. Industry guidance such as IPC-A-610 defines what an acceptable joint looks like, but no standard can recover the cost of detecting the fault late; that cost is set by how early in the process the fault is found.
This is the arithmetic that justifies 100% post-print inspection on any serious line. Inspection at the print stage is the last point where every board can be checked, individually and non-destructively, before components turn a visible deposit problem into a hidden joint problem. Everything else in this guide — the corrections, the statistics, the integration — exists to exploit that single positioning advantage.
A print process faces two questions on every single board, and they are different questions that demand different data. The first is immediate: is this board's print correct, pad by pad, right now? This is a pass/fail judgment about today's panel, and it protects the line from shipping a known-bad print into reflow. The second is directional: is the process drifting, and if so, which way? This is a trend judgment about the process, and it is what allows the line to fix a problem before it produces a reject rather than after.
The distinction matters because the data needed for each is treated differently. Immediate judgment needs tight, fixed limits and a fast decision per board — reject, flag, or pass. Drift judgment needs exactly the opposite: raw, un-filtered measurement values, accumulated over time, so that small movements in deposit volume or alignment become visible against the noise floor. A line that only passes or rejects is throwing away the trend information it already paid for; a line that only tracks trends without enforcing limits is an open loop with a camera on it.
An SMT stencil printer and SPI integration is designed so that both questions are answered from one dataset. The same volume, height and offset measurements that trigger a per-board pass/fail decision also feed the control charts that watch the process over hours and days. When the loop is wired properly, the reject limit protects the current board and the trend data protects next week's production — and the printer is the actuator that turns both signals into corrections.
Position is what makes SPI powerful. Sitting directly after the printer on the line, it inspects every board while the paste is still wet, unreflowed and attributable to a specific print stroke, stencil, paste batch and machine state. That attribution is everything: a measurement taken seconds after a defect is created points at a cause that is still present and still fixable. The same measurement after reflow would point at a joint, with the printing cause buried under thermal effects and component placement variation.
The gate also works the other way — it protects the printer's reputation from problems that are not the printer's fault. When a line's defects concentrate on particular pads, SPI data can show whether the deposits on those pads were consistently short (a stencil or aperture issue) or consistently misaligned (an alignment or support issue) or consistently variable (a pressure or paste issue). Without the inspection data, those distinctions dissolve into "print problems" and every party argues from anecdote. With the data, the correction lands on the right machine. Selecting equipment with this loop in mind is covered in the SMT solder paste printer selection guide for production lines, because the printer's data interface and correction capability determine how much of SPI's information the line can actually use.
One caution belongs here: a quality gate is only as good as the discipline behind it. If operators habitually override SPI rejects to keep the line moving, the gate becomes a data-collection point with no authority, and the statistics built on it inherit the corruption. The process rules — who can override, what gets logged, what happens to a rejected board — are part of the integration, not an afterthought to it.
Solder paste inspection sounds like photography, but the useful output is metrology. Every SPI system worth its price measures a defined set of geometric properties for every pad on every board, and each property exists because it predicts a specific reflow failure mode. Understanding what is measured — and just as importantly, what each measurement can and cannot tell you — is the foundation for everything the closed loop does with the data, because a correction can only be as good as the measurement driving it.
This section walks through the three core geometric measurements, the defect signatures layered on top of them, the difference between 2D and 3D inspection architectures, and how to read an SPI report the way a process engineer reads it rather than the way a marketing brochure presents it. The measurements follow the physics of the deposit; the deposit physics follow the stencil design rules in IPC-7525 and the paste specification in IPC J-STD-005, which is why inspection criteria and stencil design criteria line up so neatly when both are done properly.
Deposit volume is the headline measurement, and for good reason: reflow needs a specific volume of solder to form a compliant joint, and every downstream problem from opens to tombstoning to solder beading traces to volume delivered above or below target. SPI systems measure volume in cubic microns or as a percentage of the reference deposit defined in the stencil design, and they report it per pad, per component and per board. Volume accuracy depends on the system knowing the true aperture geometry — which is why good implementations import the stencil aperture file rather than assuming nominal pad shapes.
Height is the second leg. A deposit can hit its volume target by spreading too wide and too thin, which reflows into a bridge-prone footprint, or by piling too steeply, which risks probe damage and uneven reflow. Height measurement catches both. Area, the third leg, reports the footprint of the deposit against the pad — the measurement that exposes slumps, smears and partial prints that can hide inside an acceptable volume number.
The three are read together, not separately. A short deposit with correct area means the paste held its shape but the aperture starved — look at the stencil or the print stroke. A full-volume deposit with excessive area means the paste slumped after printing — look at paste rheology, ambient conditions, or the delay before placement. This is the first taste of the diagnostic reasoning the whole loop depends on: the measurements are fingerprints, and the pattern across them points at a cause.
Beyond volume, height and area, SPI classifies the geometric faults that decide whether a deposit will form a joint in the right place. Offset is the lateral shift of a deposit relative to its pad, reported in X and Y per pad and aggregated into a board-level alignment error. A consistent offset across the whole board is the signature of an alignment or program error — the most automatically correctable fault in the entire print process. A scattered offset pattern points instead at board support or warpage, which is a different fix on a different machine.
Bridging detection looks for paste between apertures that should be separate — the direct precursor to reflow shorts. It is disproportionately important on fine pitch, where the gap between deposits is measured in tens of microns and a bridge that would be harmless on an LED board is a guaranteed defect on a 0.4 mm pitch QFP. Shape classification rounds out the set: rounded or crescent deposits indicate paste sticking to the stencil undersides, irregular edges indicate aperture wall problems, and deposits with consistent tails indicate a separation speed mismatch.
The practical discipline is to treat these classifications as routing instructions. Each signature maps to a small set of likely causes and a specific owner: offset to the printer's alignment, bridging to pressure or aperture design, shape to the stencil or the separation. The measurement is doing the diagnosis; the loop is doing the routing; the engineer is doing the confirmation. That division of labor is what makes high-mix production manageable at all.
Older 2D systems inspect from directly above, measuring deposit area and coverage and inferring volume from brightness. They catch gross faults — missing prints, large bridges, severe offsets — but their height estimate is a guess, and volume is the measurement that matters most. Modern 3D systems use structured light, laser triangulation or multi-camera reconstruction to measure the actual deposit profile, and they are the only defensible basis for closed-loop volume correction. If the plan is to feed measurements back into printer parameters, 3D is not a luxury; it is the entry ticket.
The second question is repeatability. A measurement system that reads the same deposit differently on each pass will drive corrections that chase noise, and no amount of clever software fixes that. The formal tool is gauge repeatability and reproducibility analysis — running reference boards through the system repeatedly and quantifying how much of the observed variation is the deposit and how much is the instrument. A sound target is for measurement variation to consume only a small fraction of the process tolerance; if GR&R eats 30% of the tolerance band, the loop will oscillate on phantom changes and confidence in every number downstream erodes.
Repeatability also degrades with physics: shiny, unreflowed paste is specular and moves, which is why SPI systems invest in lighting control, multiple viewing angles and algorithms that tolerate surface reflection. When evaluating equipment, ask for repeatability data on your own paste and foil, not the vendor's reference panels — and remember that the stencil's contribution to deposit quality, covered in the fine-pitch and 0201 printing guide, sets the real-world variation the instrument must resolve through.
An SPI report is usually presented as a board image with colored pads — green passing, yellow marginal, red failed — and that view answers the immediate question but hides the directional one. Reading the report like a process engineer means moving through three zoom levels, each with its own question and its own decision attached. The table below maps the levels to the decisions they support.
View level | What it shows | Question it answers | Decision it drives |
|---|---|---|---|
Per pad | Volume, height, area, offset for one pad over time | Is this specific pad drifting? | Aperture edit, stencil review, local program fix |
Per board | Alignment error pattern across the panel | Was this print aligned and supported correctly? | Immediate offset correction, support check |
Per shift / per roll | Means and distributions across production time | Is the process stable or trending? | SPC action, parameter change, maintenance trigger |
The zoom levels chain together in diagnosis. A per-shift trend that shows volume declining is not actionable until the per-board view reveals whether the decline is uniform (a paste or pressure cause) or concentrated (a stencil or support cause), and the per-pad view confirms which apertures are involved. Skipping levels produces the two classic failure modes of inspection programs: acting on a single pad outlier that was never real, and ignoring a slow board-level drift because no individual board ever failed.
One reporting discipline worth institutionalizing: every SPI reject and every correction that follows should leave a traceable record — board ID, pad list, measured values, action taken, and the re-measurement that verified the action worked. That record is what turns a quality gate into a learning system, and it is the dataset that the statistical methods in the rest of this guide consume.
Measurement without correction is commentary. The reason SMT stencil printer and SPI integration earns its capital line is that specific, well-defined classes of SPI measurement map onto specific, well-defined printer adjustments, and a properly configured line can make some of those adjustments faster, more consistently and less emotionally than any operator. This section walks through the three correction channels in the order they mature on a real line: alignment offset feedback, which is the most reliable and most automated; volume feedback to print parameters, which is powerful but demands statistical discipline; and aperture-level feedback, which routes corrections back to the stencil rather than the machine.
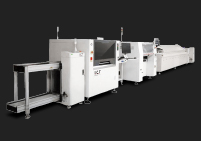
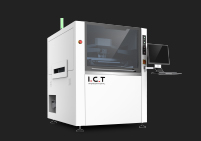
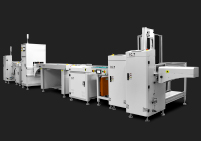
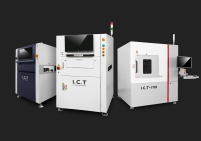
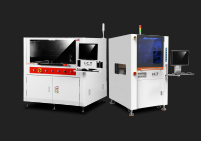
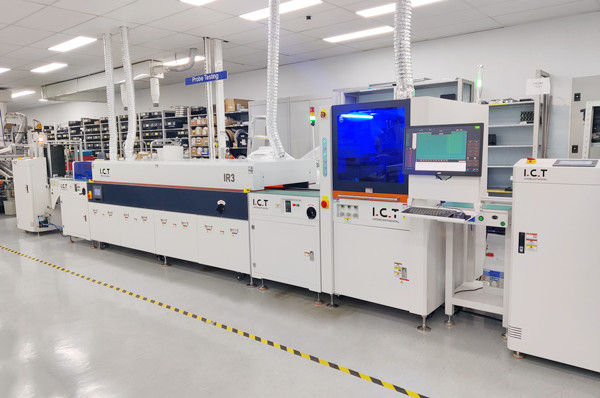
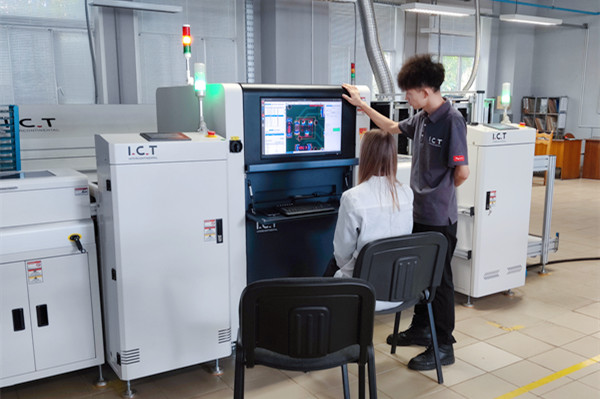
Two principles govern all three channels. First, a correction should only act on a cause the printer actually controls — sending alignment drift to a pressure actuator is how loops destabilize. Second, every automatic correction must be bounded, logged and verifiable: bounded so a bad measurement cannot drive the process into a wall, logged so the correction history is auditable, and verifiable so the loop can confirm its own adjustments actually moved the measurement. The figure below shows the physical pairing these principles operate on.

Alignment offset is the cleanest correction in the loop because the cause and the actuator are unambiguous. When SPI reports a consistent X, Y or rotational shift of deposits relative to pads across an entire board, the printer's vision alignment either missed by that amount or the board moved after alignment — and in both cases the fix is to shift the printer's alignment reference by the measured error. Closed-loop implementations do exactly that: SPI sends the offset vector back, the printer applies it to the next board's placement coordinates, and the next SPI reading confirms the correction landed. On a healthy line, this loop converges within one or two boards.
The reason this works when manual correction often does not is that the SPI measurement is objective and pad-dense. An operator eyeballing a misaligned print on one board makes a judgment; SPI averages the offset across hundreds of pads and separates a true translation error from a rotation error, from a scaling error caused by board warpage. That last distinction is critical — a scaling error means the board is not flat, and the right correction is not a program shift but the board support work described in the board support and fiducial alignment guide for stencil printing. The inspection data routes the fault to the right actuator, which is precisely what makes automatic correction safe.
The discipline that keeps offset correction stable is bounded adjustment. Programs typically limit each correction step to a fraction of the measured error and cap the cumulative offset adjustment within a defined window; outside that window, the loop stops correcting and raises an alarm, because a persistent large offset is no longer a correction problem but a root-cause problem — a loose fixture, a failing vision camera, a warped panel — that no amount of nudging will fix.
Volume feedback is the most tempting and the most dangerous channel in the loop. Tempting, because SPI volume data and printer pressure and speed settings are obviously connected; dangerous, because the connection runs through paste rheology, stencil condition and ambient humidity, and an aggressive automatic correction that bumps pressure every time volume wobbles will oscillate the whole process. The sound version of volume feedback works on trends, not points: it acts when the volume distribution has moved persistently — over dozens of boards, not two — and it adjusts one parameter at a time by a small, bounded step.
The standard mapping is well established. Persistent low volume across the board points at insufficient fill: the loop raises squeegee pressure a step or slows print speed, and the next inspection batch confirms or rejects the change. Persistent high volume or paste left on the foil points at over-pressure, and the loop steps pressure down. Under-stencil cleaning intervals interact with both — a stencil whose apertures are slowly clogging shows up first as a creeping volume decline on the finest apertures, which a trend-based loop catches hours before it produces defects. Separation speed and height, which control how cleanly paste releases from apertures, respond to a different signature: volume loss concentrated on specific aperture geometries rather than uniformly.
What separates a stable volume loop from an oscillating one is hysteresis — the deliberate refusal to react inside a dead band. Volume that wanders within the process's natural variation should trigger nothing; only movement that exceeds both the dead band and the persistence rule earns a parameter change. Lines that skip the dead band discover that their printer and SPI machines make excellent partners in a mutually amplified argument, with pressure marching up and down all shift while the deposits were fine all along.
Not every correction belongs to the printer, and the loop's diagnostic layer is what makes that distinction actionable. When SPI volume deficits concentrate on particular pads — the same apertures short board after board while the rest of the panel prints to target — no printer parameter will fix it, because the cause sits in the stencil: an aperture cut below its area-ratio floor, wall damage, or paper-backed residue the under-stencil cleaning cannot reach. The correct action routes back to the stencil, and the data identifies exactly which apertures and exactly what geometry. This is where the stencil-side decisions described in the stencil and squeegee selection guide get verified or falsified by production data.
Aperture-level feedback earns its keep in three situations. New product introduction, where a fresh stencil's marginal apertures reveal themselves within the first production day instead of as a yield mystery weeks later. Fine pitch, where a single under-performing aperture on a dense device is a per-board defect generator that board-level averages hide completely. And consumable aging, where gradual aperture polishing or damage shows up as a slow per-pad divergence that trends analysis can catch while it is still a re-tensioning or cleaning decision rather than a scrapped stencil.
The organizational requirement is a routing rule: someone owns the decision of which channel a finding goes to — printer parameters, stencil, paste or support — and the SPI system should support tagging findings by cause. Without ownership, aperture-level findings default to parameter fiddling, the stencil never gets fixed, and the loop's credibility erodes one unresolved finding at a time. A useful audit question for any line claiming closed-loop control: show me the last ten findings that were routed to the stencil, and what happened to them.
Between the measurement and the correction sits the hard intellectual work of the loop: knowing which parameter actually moves which measurement, by how much, in which direction, on your paste, your foil and your machine. Generic cause-and-effect tables exist and are a reasonable starting point, but every line's true response curves differ, and the lines that correct confidently are the ones that have measured their own curves. This section covers the standard parameter-to-metric mappings, the designed experiment that establishes them properly, and the statistical hygiene that keeps correlation from being mistaken for cause.
The payoff for this discipline is speed during incidents. When SPI data shows a signature — uniform volume loss, per-pad divergence, growing offset — an engineer with a measured response model knows within minutes which parameter to move, which direction, and roughly how far. An engineer without one is running a search algorithm across pressure, speed, separation and cleaning settings while the line waits. An SMT stencil printer and SPI integration delivers data; the correlation model is what converts it into answers.
The first-order relationships between print parameters and SPI measurements are stable across the industry, and they are worth internalizing before any experiment is designed. The table below summarizes the mappings that matter, with the honest caveat that the strength of each effect depends on where the process currently sits — a pressure change moves nothing if pressure is already saturating the apertures, and a speed change matters enormously at fine pitch and barely at all on coarse LED boards.
Print parameter | Primary SPI metric affected | Direction of effect | Secondary effects to watch |
|---|---|---|---|
Squeegee pressure | Volume, paste left on foil | Too low: starving, residue; too high: scooping, wear | Bridging from paste packed into apertures; foil wear |
Print speed | Volume uniformity, fill on fine apertures | Too fast: starved fine pitch; too slow: slump, throughput loss | Roll behavior, temperature of paste |
Separation speed | Deposit shape, tailing, volume on small apertures | Too fast: peaked deposits, paste pull-back | Smear on foil underside |
Alignment (X/Y/theta) | Offset, per-pad area distribution | Error shifts deposits off-pad | Bridging and opens at pitch extremes |
Under-stencil cleaning | Volume trend on small apertures, bridging | Stale cleaning: creeping volume loss | Wet vs dry vs vacuum cycle interaction |
Read the table as a diagnostic index, not a tuning recipe. The measurement signature selects the row; the row nominates the parameter; the correction then follows the bounded-step discipline from the previous section. When two rows fit the same signature — creeping volume loss fits both cleaning staleness and pressure drift — the tie-breaker is evidence, which is what the next subsection's experiments establish before incidents occur.
A designed experiment on a working line sounds like a luxury, but it is the only way to own the response curves, and it need not be elaborate. The practical form: hold everything constant, step one parameter across a small, safe range — pressure from its current setting up and down in two or three steps, for example — and let SPI record the deposit response across several hundred boards per step. Because the line already measures every pad on every board, the sample size is enormous and the experiment costs a few hours of production time rather than a dedicated test run.
Two disciplines make the results trustworthy. First, randomize or interleave conditions where possible, because paste age, ambient temperature and stencil wear all drift through a shift and will otherwise contaminate a clean parameter effect. Second, record the nuisance variables alongside — paste batch, paste time on stencil, ambient conditions, board batch — so that a confounded result can be detected rather than trusted. The output is a small response model per product family: how volume responds to pressure, how fill responds to speed, and where the plateaus are.
The plateaus are as valuable as the slopes. Knowing that volume is flat across a 20% pressure band tells the loop's dead band where to sit — corrections inside a plateau are noise-chasing by definition. It also tells operators which parameter is safe to touch during minor upsets and which is calibrated tightly, which is exactly the institutional knowledge that survives staff turnover.
The failure mode that ruins more feedback loops than any hardware deficiency is overcorrection: reacting to variation that would have resolved itself, amplifying it into oscillation, and teaching the whole line that the automated suggestions are noise. Paste printing variation has multiple slow drivers — paste aging on the stencil, ambient humidity, cleaning cycle position — and a correction aimed at one driver while another is momentarily dominating will overshoot. The defenses are statistical, and they are worth listing as a checklist: dead bands around target, persistence rules before any action, bounded step sizes, single-parameter changes, and a cool-down period after each correction before the next is permitted.
The second defense is separating special-cause from common-cause variation, which the control-chart methods in the next section provide. A loop that reacts only when a chart signals a genuine special cause, rather than whenever a value looks inconvenient, inherits the statistical credibility of the chart itself. This is why mature implementations gate automatic corrections behind SPC signals instead of raw thresholds — the chart has already filtered out the noise the raw threshold would have reacted to.
Finally, keep humans in the loop for the corrections that matter most. Automatic offset correction is well proven and can run unattended; automatic pressure changes deserve a notification-and-confirm architecture on most lines until months of data establish the loop's judgment. The goal is not to remove the engineer but to remove the tedium, so that the engineer spends attention on the findings the software cannot route — and trusts the ones it can.
SPI produces something rare in electronics manufacturing: a continuous, automated, high-dimensional measurement stream of the physical output of a process, taken 100% at line rate. That stream is the raw material of statistical process control, and SPC is what converts the loop from a defect-catching system into a defect-preventing one. The logic is standard quality engineering — control charts, capability indices, trend rules — but paste printing gives it an unusually clean application because the measurement is direct, fast and dense.
This section covers the three SPC layers that matter for print process control: control charts that define what "in control" actually means, capability indices that quantify whether the process deserves its limits, and trend rules that catch drift while it is still cheap to correct. An SMT stencil printer and SPI integration is what makes all three real-time rather than retrospective; IPC-9191 provides the general framework for implementing SPC of this kind, and its structure maps directly onto the print process.

A control chart plots a process measurement over time against statistically derived limits — the natural voice of the process, not the engineering tolerance — and flags points that fall outside or patterns that suggest a shifted mean. For paste printing, the charted quantities are typically the mean deposit volume per board (or per critical component), the volume standard deviation across pads, and the mean alignment offset. The control limits come from the process's own history when it was known to be running well, which is why the baselining phase in the implementation section matters so much.
The chart's central lesson is the distinction between stability and specification. A process can be perfectly in control and still produce out-of-spec deposits if its natural spread exceeds the tolerance — that is an incapable process, and no amount of control charting fixes it. Conversely, a process can meet spec today while drifting steadily toward disaster — that is an out-of-control process that still happens to be passing. Charts catch the second case, which pass/fail inspection structurally cannot, and they catch it hours or days earlier.
Practical charting discipline for print lines: chart per product family rather than mixing products, because different apertures and foils have different natural spreads; recompute limits when the stencil, paste or blade changes, because those are new processes wearing the same product name; and treat every out-of-control signal as a documented investigation with a recorded cause, because uninvestigated signals train the line to ignore the chart.
Where control charts answer "is the process stable", capability indices answer "is the process good enough". Cp compares the process's natural spread to the tolerance width; Cpk additionally accounts for off-center operation, and for paste deposits Cpk against the volume tolerance is the single most informative capability number a line can compute. A Cpk of 1.33 is the conventional minimum for a process running without 100% inspection downstream; paste processes feeding fine-pitch reflow commonly target higher, because the deposit is the first domino in a chain of variation that placement and reflow each add to.
The power of capability numbers is in what they prevent: arguing about individual boards. When a line's deposit-volume Cpk is 0.9, the process will manufacture a predictable percentage of defective deposits no matter how attentively anyone watches the chart, and the correct response is a process change — a thinner foil, a different blade, a paste with better transfer efficiency — not tighter watching. When Cpk is 1.8, occasional excursions are special causes to be hunted, not reasons to redesign anything. Capability tells you which conversation you are in.
Capability analysis also gives the SPI investment its honest scorecard. Before the loop, record the baseline Cpk of the print process; after the loop has been running with corrections active, record it again. The delta — typically a tightening of the volume distribution and a reduction in alignment spread — is the quantified return on the integration, and it makes the next equipment or training request a data-backed case rather than an opinion.
Between "in control" and "out of control" lies the territory where the best process control lives: statistically unlikely patterns that precede any limit violation. Western Electric rules and their derivatives codify these — a run of points on one side of the centerline, six points steadily rising or falling, two of three points near a control limit — and they exist because drift announces itself in shape before it announces itself in magnitude. A print process heading toward trouble typically shows a slow volume slide as apertures begin to clog, or a widening volume spread as a blade edge begins to wear, days before either produces a reject.
Trend rules are also where the correction channels from earlier sections meet the statistics. A persistent one-sided run is exactly the "persistent movement" signal that the volume-feedback loop is allowed to act on; a widening spread is a signal the loop should not act on at all, because spread is not corrected by parameters — it is a blade, foil or paste conversation. Encoding which chart patterns authorize which responses, and which merely alert a human, is the last piece of design in a well-behaved loop.
The discipline that keeps trend rules useful is calibration against false alarms. Every rule has a false-alarm rate, and stacking too many rules on too many charts guarantees alert fatigue and ignored dashboards. Start with the classic run rules on the two or three charted quantities that matter most — mean volume, volume spread, mean offset — and add rules only when a documented drift slipped through the existing set.
There is no single way to wire a printer and an SPI machine together, and the right architecture is a function of volume, mix, maturity and budget rather than of ambition. The industry's spectrum runs from offline inspection with human-routed feedback, through inline 100% inspection with automatic flagging, to fully closed-loop systems where the machines negotiate corrections themselves. Each stage on that spectrum buys real capability, and each demands something different from the organization around the machines — this section maps the spectrum so the choice is a decision rather than a default.
The unifying principle is data flow: what measurements travel where, how fast, and with what authority to change machine behavior. Everything else — conveyor interfaces, software protocols, review stations — exists to move the measurement from the point of creation to the point of decision with its attribution intact. When evaluating any proposed architecture, trace one defect's data through the whole path; wherever the trail goes cold, the architecture has a gap. An SMT stencil printer and SPI integration succeeds or fails on those data paths far more than on any machine spec sheet.
Architecture | Data flow | Correction latency | Best fit | Key requirement |
|---|---|---|---|---|
Offline SPI | Sampled boards to bench machine; findings reviewed, relayed manually | Hours | Prototypes, very low volume, NPI | Disciplined feedback routing |
Inline, open-loop | 100% inspection; rejects flagged and removed automatically | Immediate reject, delayed correction | Most volume production | SPC review routine |
Inline, closed-loop | Measurements feed printer corrections automatically | Minutes, bounded | High volume, fine pitch, high mix with recipes | Correlation model, bounded rules |
Offline inspection — sampling boards from the line and measuring them at a bench machine — is where most lines start and is genuinely sufficient for prototypes, engineering builds and very low volumes. The value is real: measurements exist, marginal apertures are found before reflow, and the print process accumulates a baseline dataset. The weakness is latency and attrition: findings travel through a review, a conversation and a shift handover before they reach the printer, and each hop loses urgency, context and occasionally accuracy.
Making offline feedback work is an organizational project more than a technical one. The mechanisms that matter: a fixed review rhythm rather than when-someone-gets-to-it; a simple routing form that tags each finding with its cause and its owner; and a re-measurement step that closes the loop visibly by confirming the correction worked. Semi-automatic lines pair naturally with this stage — a precision semi-auto platform such as the I.C.T P3 semi-auto dual-squeegee PCB printer benefits immediately even from sampled inspection, because its operator is close enough to the process to act on findings within the same session.
Be honest about the ceiling: offline sampling inspects a fraction of production, so its control charts measure the sample, not the process, and rare events sail through unseen. The architecture's real role is as a training ground — the correlation studies and baseline data from offline inspection are exactly what the inline stages consume when the line grows into them.
Inline inspection moves the measurement onto the line and applies it to every board. The first capability this buys is containment: rejects are flagged and diverted automatically, and no operator judgment call decides whether a marginal print continues to placement. The second is data density: with every board measured, control charts describe the actual process rather than a sample, and drift that sampling would average away becomes visible within a shift. High-volume LED lines are a natural home for this stage, where a platform such as the I.C.T 5134 online fully automatic solder paste printer for LED runs at line rate and an inline SPI keeps volume and alignment on target across panels whose economics are unforgiving of scrap.
The step from inline-open-loop to closed-loop is a software and discipline step, not a hardware one: the same measurements that flag rejects are exported to the printer as offset corrections and, once the correlation model and bounded rules from earlier sections exist, as parameter adjustments. Migration is best done in that order — containment first, charts second, automatic corrections last — because each stage validates the data quality the next one will act on. Enabling automatic correction on unreviewed data is how lines teach their loop to trust noise.
One operational note: inline does not mean unsupervised. The review station shifts from inspecting boards to investigating signals, and its throughput — findings dispositioned per day — becomes the architecture's real bottleneck. Staff the review station like a process control room, not like an inspection bench.
The unglamorous layer underneath any architecture is line integration, and it determines whether the machines can even hold the conversation. Conveyors hand boards over with the SMEMA signal standards that let upstream and downstream equipment synchronize flow; modern implementations add machine-to-machine data channels over the factory network so that measurements, recipes and flags travel alongside the boards. The physical placement question — SPI immediately after the printer versus after a buffer — matters more than it appears, because every board between the print and the measurement weakens attribution: with a buffer in between, a flagged deposit belongs to a print stroke that happened minutes ago on boards that have since moved.
Placement exceptions exist and are legitimate. Long-board lines frequently inspect after placement support zones for mechanical reasons, and platforms built for extreme lengths — the I.C.T 1500 long-board fully automatic LED PCB stencil printer class — simply carry their inspection pairing further downstream, accepting the attribution cost because the alternative is no inline inspection at all. What matters is that the attribution gap is known and compensated: with longer transport, board-level serialization becomes the thread that ties a measurement back to its print stroke, which elevates traceability from an MES nicety to a functional requirement of the loop.
Integration questions to settle during procurement rather than commissioning: which machine hosts the correction logic, what protocol carries measurements, how recipes stay synchronized when either machine is updated, and what happens to in-flight boards when the loop is paused. These are answerable questions with ordinary engineering effort — but only if asked before the machines are bolted to the floor.
The measurement stream's value compounds when each record carries its context: board serial, product recipe, paste batch, stencil serial and its print count, blade ID, ambient conditions, and the machine states that produced the deposit. That context is what allows a finding to be traced forward — every reflowed assembly built from a marginal print — and backward — every deposit measured after a parameter change. Traceability infrastructure is what makes recalls narrow, quality escapes attributable, and the loop's own decisions auditable months later.
The historian layer, whether a full MES module or a disciplined export pipeline into plant data systems, also unlocks the analyses that single machines cannot run: correlation of paste age against volume trends, stencil print-count against aperture-level divergence, ambient humidity against bridging rates. These multi-variable questions are where the chronic, background losses hide, and they are only visible when machine data, material data and environment data land in the same place with timestamps that agree.
A pragmatic warning about data gravity: historians make it tempting to archive everything and analyze nothing. The discipline that keeps the historian useful is the same reporting cadence from the earlier sections — a small set of reviewed quantities, on a fixed rhythm, with documented dispositions. Archive at full resolution, review a curated subset, and the historian serves the loop instead of burying it.
A guide that only praises its subject is a brochure, and the printer-SPI loop has genuine limits that are better understood before purchase than after. The loop measures and corrects deposits — that is its jurisdiction — and its authority ends wherever a cause lies outside that jurisdiction. Knowing the boundary is not a caveat; it is what prevents the two most expensive mistakes in print process control: expecting the loop to solve problems it cannot see, and blaming the loop for problems it correctly reported but could not own.
This section maps the boundary in three directions: upstream, where root causes sit in materials and machine conditions the printer only exhibits; downstream, where the deposit's fate depends on processes the inspection never observes; and inward, at the measurement system itself, where a wrong number is worse than no number because the loop will faithfully act on it.
The loop will detect, with great sensitivity, the symptoms of causes it cannot reach. Paste at the end of its stencil life prints with rising viscosity and declining transfer efficiency; the SPI data shows the volume slide perfectly, but the correction channels — pressure, speed, separation — treat the symptom and the paste still needs replacing. A stencil past its tension life prints with growing smearing and per-pad inconsistency that no parameter rescues. Ambient humidity swings shift paste rheology through the shift. Board warpage from upstream handling changes the stencil-to-pad gap and appears in the data as scattered offset and per-pad volume variance that looks, to a naive loop, like an alignment problem.
The mature response is to treat the loop as a detector for these upstream causes, not a cure for them. Each symptom class gets a documented route: persistent volume decline despite bounded corrections ends at the paste; growing spread ends at the blade and stencil; scattered offset ends at support and flatness. The value the loop adds is that these routes trigger on data hours or days before the human eye would notice — but the actions themselves still belong to material management and maintenance, and no amount of integration replaces them.
The one upstream lever that genuinely improves what the loop can do is mechanical: board support and flatness. SPI data will diagnose a flatness problem quickly, but the fix lives in the printer's support infrastructure, and the lines whose loops stay stable long-term are consistently the ones that invested there early.
A deposit that measures perfectly can still produce a defective joint, and the loop has no visibility into why. Reflow profile mismatches turn compliant deposits into dull, grainy or voided joints; a tombstone on a chip component can originate as much from placement asymmetry or pad design as from paste volume; solder beading can trace to flux activity rather than deposit geometry. Post-reflow inspection — AOI, X-ray, functional test — covers this territory, and the print loop's responsibility ends at delivering measured, on-target deposits to the placement step.
The practical consequence is diagnostic discipline when defects appear after reflow. The instinct to blame the print is strong because printing is the highest-variance step, but the loop's own records make the print case testable: if the deposits on the failing joints measured in-spec at SPI, the print is exonerated with data, and the investigation moves to placement and reflow with its credibility intact. Lines that lack SPI data cannot run this exclusion, so every post-reflow defect starts a broad, slow argument across three process owners.
The blind spot also shapes expectations correctly in the other direction: SPI cannot predict which marginal-but-passing deposits will fail after reflow. A deposit at 85% of target volume may reflow into an acceptable joint on one paste and a marginal one on another. The loop's job is to hold deposits at target; converting target into joint quality is the reflow process's job, and the two specifications should be negotiated together rather than assumed.
The scariest failure mode of an integrated loop is not a missed defect but a confidently wrong measurement, because the loop will act on it with perfect obedience. False calls — rejects on deposits that are actually fine — usually stem from lighting edge cases, specular reflection on particular pad finishes, or apertures whose geometry sits outside the system's calibrated assumptions. Missed calls are rarer but worse, and both corrupt the statistics in opposite directions: false calls inflate the reject rate and, if corrections respond to them, push the process off target; missed calls silently poison the baseline that every limit and capability number is built on.
The defenses are procedural and cheap relative to the damage they prevent. Regular verification with reference boards of known geometry catches instrument drift early. A false-call review that inspects a sample of rejected boards confirms or recalibrates the thresholds. Override authority stays narrow and every override is logged — a reject that an operator waves through must be re-measured, not forgotten, because it is either a bad call to fix or a bad deposit that just escaped. And gauge studies repeat whenever paste, board finish or stencil material changes materially, because the measurement system's performance is conditional on those variables.
Culture is the last line of defense: a line that treats every SPI reject as certainly real will accumulate silent escapes behind confident dashboards, and a line that treats every reject as doubtful will teach its loop to be ignored. The workable posture is that measurements are evidence requiring confirmation at the margins — trusted in the bulk, audited at the edges — and that posture is written into the process documents, not left to habit.
Everything in this guide reduces to a deployment sequence, and the sequence matters because each phase builds data and trust that the next phase consumes. Lines that switch a loop on and expect corrections from day one get oscillation and disillusionment; lines that phase the work get a stable loop whose automatic actions engineers trust enough to leave running unattended. The three phases below assume an existing line with a printer and an SPI machine already capable of data exchange — if procurement is still ahead of you, the architecture choices in the sixth section are the first item on this agenda. An SMT stencil printer and SPI integration is a project measured in weeks of disciplined work, not a checkbox on an install sheet.
Budget the phases by their outputs rather than their durations: phase one ends when you own your process's response curves and baseline statistics; phase two ends when corrections act only on authorized signals within bounded rules; phase three is permanent and is what keeps the first two honest. The table summarizes the sequence before the subsections detail it.
Phase | Focus | Key outputs | Exit criterion |
|---|---|---|---|
1. Baseline & correlate | Instrument verification, DOE on parameters, baseline SPC | Response model, control limits, capability baseline | Limits agreed and signed off by process owner |
2. Limits & corrections | Enable flagging, then bounded offset correction, then parameter rules | Correction rules, dead bands, escalation paths | Corrections run unattended without oscillation |
3. Audit & improve | False-call review, capability tracking, periodic re-baselining | Audit records, capability trend, review cadence | Capability trend stable or improving |
Phase one is measurement engineering, and it starts with trusting the instrument: reference boards through the SPI machine, repeated, until the gauge's repeatability on your paste and foil is a known number rather than a datasheet claim. Then the designed experiments from the fourth section establish the response curves — pressure to volume, speed to fill, separation to shape — for each product family that matters, interleaved to defeat drift and recorded alongside paste age and ambient conditions. Finally, the baseline: control limits from real running data, capability indices before the loop acts, and a signed agreement on which quantities are authoritative.
This is also the phase that surfaces whether the machines can hold the conversation at all: export formats, recipe synchronization, clock alignment between the two machines' logs. Precision semi-automatic lines doing this for the first time — a platform like the I.C.T P12 high-precision semi-automatic stencil printer paired with offline or entry-inline SPI — should expect phase one to be mostly manual but no less valuable, because the correlation model is architecture-independent and transfers when the line automates.
Resist the temptation to shorten phase one into a commissioning week. Every shortcut here becomes a wrong limit, and a wrong limit inside a closed loop is a machine confidently acting on bad statistics — the exact failure the whole discipline exists to avoid.
Phase two turns the correlation model into machine behavior, and the order of enabling is deliberate. Flagging first: rejects divert automatically and review findings land in the routing process, with no automatic correction yet. Offset correction second, bounded and logged, because it is the most mature channel and converges visibly. Parameter corrections last, gated behind the SPC signals and dead bands from the fifth section, enabled one channel at a time with a soak period at each step before the next unlocks. Every rule gets an escalation path — the condition under which the loop stops and a human takes over — and those paths are tested, not just documented.
The phase's exit criterion is operational, not technical: corrections run for a defined period without oscillation, without unexplained corrections, and with every automatic action traceable in the log. When that holds across product changeovers and at least one paste or stencil change, the loop has earned unattended status for the channels it has passed. Channels that have not passed stay manual — permanently, if their data never gets clean enough, which is a legitimate outcome the bounded design anticipates.
Write the phase-two rules into the process documentation in the same language the machines use: which measurement, which signal, which parameter, which bound, which escalation. Verbal loop rules evaporate with staff turnover, and a loop whose rules live only in one engineer's head is a single resignation away from open loop.
Phase three is permanent, and its first discipline is the false-call review from the seventh section: a sample of rejects re-measured, thresholds recalibrated, gauge studies repeated after material changes. Its second is capability tracking — the Cpk trend is the loop's report card, reviewed on a fixed cadence, with re-baselining whenever the stencil, paste, blade or product changes materially, because those are new processes wearing old names. Its third is training, which in practice means teaching every new operator and engineer the loop's ground rules: what corrects automatically, what only alerts, what routes to the stencil, and why overriding a reject without re-measurement is the fastest way to corrupt everything downstream.
The continuous-improvement loop rides on the same data: chronic findings that keep routing to the stencil are aperture-design conversations with the foil supplier; chronic findings that route to support are flatness investments; chronic cleaning-related corrections are interval-tuning evidence. Over quarters, this is how the loop's biggest wins arrive — not from catching bad boards, but from the accumulating record of small, confirmed corrections that lets the line shrink its dead bands and tighten its targets without instability.
Close the implementation the way the guide opened: the loop exists because defects are cheapest where they are born. Audited, trained and continuously re-baselined, the printer-SPI pairing stops being an inspection expense and becomes what it was always designed to be — the process-control backbone of the print step, holding every deposit at target while the line runs at full speed.
Talk to an I.C.T process control specialist
If you are planning an SMT stencil printer and SPI integration, or wondering why an existing loop keeps oscillating, the fastest route to answers is to show us your process rather than describe it. Tell us your finest pitch, your highest-volume product, your current SPI platform and your rejection patterns — we will return a concrete assessment: which correction channels your printer and SPI combination can safely run today, which belong behind bounded rules, and where your data paths need tightening before automatic correction is worth enabling. Where the application calls for new equipment, we will point you into the I.C.T solder paste printer range with the data interfaces and correction capability the loop requires, matched to the inspection platform you already run or plan to run.
The argument of this guide is that print stability is a system property: the printer deposits, the SPI measures, and the loop between them turns measurement into control. Specify the pair as one system — data paths, correction rules, escalation paths, review cadence — and the print step stops being the line's largest source of defects and becomes its best-instrumented process. Send us your worst-performing product; we will help you make the loop close on it.
Modern 3D SPI measures deposit volume, height and printed area for every pad, plus lateral offset relative to the pad, and classifies defect signatures such as bridging, smearing and shape irregularities. Volume is the headline measurement because reflow joint quality depends directly on delivered solder volume; height and area reveal slumping and spreading that can hide inside an acceptable volume number. The measurements are geometric and non-destructive, taken while the paste is still wet.
Yes, for well-defined channels and within bounds. Automatic offset correction — feeding the measured X/Y/theta error back into the printer's alignment reference — is the most mature and safest channel. Volume-driven corrections to pressure and speed are also widely used, but only with dead bands, persistence rules and bounded step sizes so the loop does not chase noise. The mature approach enables offset correction first, then adds parameter corrections one channel at a time with a soak period.
For correction purposes, no. 2D systems estimate volume from a top-down brightness image, and that estimate is not accurate enough to drive parameter changes without oscillation. 2D remains useful for gross fault detection — missing prints, large bridges, severe offsets — but closed-loop volume correction needs the true 3D deposit profile that laser triangulation or structured-light systems measure. Gauge repeatability on your own paste and foil matters as much as the 2D/3D label.
Persistent false calls usually trace to the measurement system rather than the process: lighting edge cases, specular reflection on certain pad finishes, or apertures outside the system's calibrated geometry assumptions. Start with a false-call review that re-measures a sample of rejected boards, then verify the instrument with reference boards, then check whether recent changes to paste, board finish or stencil material changed the measurement conditions. Never tune thresholds down to silence rejects without re-measurement — that trades visible nuisance for invisible escapes.
There is no universal number, because tolerance depends on pad geometry, paste and reflow window — but the governing logic is capability rather than a fixed percentage. As a planning posture, target deposit-volume Cpk comfortably above 1.33 against your process's agreed tolerance, and tighten further for 0201-class and 0.4 mm pitch work. Qualify uncertain figures against your paste supplier's data and your own SPI baseline rather than generic benchmarks, and let capability indices, not individual boards, decide whether the process needs redesign.
Immediately after the printer whenever the line layout allows, because measurement proximity preserves attribution — each flagged deposit belongs to a print stroke seconds old, with the machine state that produced it still current. When mechanical constraints force inspection after a buffer or further downstream, board-level serialization becomes mandatory so measurements can be traced back to their print strokes, and the loop's correction latency grows accordingly. Settle placement during line design, not commissioning.
No — it relocates it. The loop removes routine nudging from the engineer's day, but every judgment that matters is still human: setting limits, designing the correlation experiments, routing findings to stencil versus paste versus support, auditing false calls, and re-baselining after material changes. A closed loop with no process ownership behind it produces confident-looking dashboards over an oscillating process. The correct expectation is that the loop automates the tedium and sharpens the evidence, not that it replaces the discipline.
At minimum: board serial and product recipe, the per-pad measurements with their limits, the machine state that produced the deposit — squeegee pressure, speed, separation, alignment values, stencil print count and serial, paste batch and age — plus every correction the loop applied and every override an operator made. That context is what turns a reject into a diagnosis and a trend into an investigation. Archive at full resolution, but review a small curated set of quantities on a fixed cadence, or the historian buries the loop.