English
Views: 0 Author: Elsa Long Publish Time: 2026-11-19 Origin: Site


Commissioning ends when the line runs. Ramp-up ends when the line runs the same way on a bad Tuesday as it did on the good Friday of the acceptance test. Those are different finish lines, and projects that treat them as one finish the first and then spend a quarter discovering the second. The line is installed, the first article passes, the acceptance protocol is signed, and three weeks later the scrap rate is still four times the quotation, because nobody wrote down what "stable" was supposed to mean or who was allowed to release the line into it.
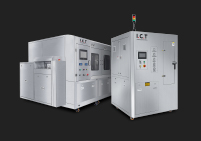
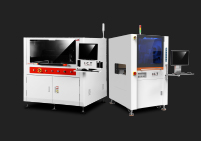
This PCBA factory production ramp up plan sets out the stages between the two finish lines — equipment integration, first article, process windows, trial production, defect closure, operator certification — and gives each one a release condition rather than a duration. Every number in the worked examples is a stated assumption for illustration, not a measurement from a named project, and none of it replaces your own process data. The equipment those stages are applied to is described under the line configurations whose output a ramp-up plan is measured against, and the plan matters far more than the machine class once installation is finished.
A ramp-up plan answers one question that a commissioning report cannot: does this line produce the same result when nobody is watching it closely? The answer is built from evidence collected in a fixed order, because each stage assumes the previous one is true. Integration assumes the mechanics are right, first article assumes integration is done, trial production assumes a process window exists, and stable output assumes defects are already closed. Skip a stage and the next one inherits an unknown, which is why so many ramps stall in the middle with a line that passes acceptance and fails production. The plan below is therefore written as a set of gates rather than a set of weeks, and each gate has a question, an evidence pack and a named person who is allowed to say yes. It is also the practical form of a PCBA factory production ramp up plan: a document that can be argued with, not a schedule that can be moved by a meeting.
Equipment readiness, process capability and operator speed improve on completely different clocks, and most ramp plans are written as if they improved together. Equipment readiness is close to binary: the line either transfers a board through every station or it does not, and that usually happens within days of installation. Process capability improves in steps, each one requiring data, a change and a re-measurement, and it is the curve that decides yield. Operator speed improves slowest of all, because it depends on repetition, and it is the curve that decides throughput at a given headcount. A plan that assumes all three arrive on the same date will schedule a volume commitment that the third curve cannot meet.
Treating them separately changes what gets measured each week. Equipment readiness is tracked as open punch-list items. Process capability is tracked as first-pass yield and the width of the process window. Operator speed is tracked as cycle time at a fixed staffing level, or as the number of boards per hour on a single product. When a ramp is behind, the first useful question is which of the three curves is behind, because the remedies are different: a punch-list item needs a technician, a capability gap needs an experiment, and a speed gap needs repetition and a simpler standard work sequence.
A milestone is a date somebody promised. A release gate is a condition somebody verified. The difference shows up when the project is late: a milestone gets renegotiated, a gate gets either passed or not, and the line stays where it is until it is. That rigidity is the point. A gate that can be moved by a meeting is not a gate, and the ramp plan's authority comes entirely from the fact that volume cannot start until the evidence exists. In practice, gates are dated in the plan so that they can be resourced, but the date is an expectation and the condition is the commitment.
Each gate needs three things to be usable: a question written as a yes-or-no, an evidence pack that answers it without interpretation, and a signatory who is accountable for the answer. The question should be narrow enough to be answerable — "does the line hold the print window across a full shift" rather than "is the process ready". The evidence pack should be a fixed set of records produced by the gate itself, so that assembling it is not a separate project. The signatory should be the person who will live with the consequence, which for process gates is usually the process owner rather than the project manager. The same discipline applied to the whole project, rather than to the ramp alone, is what the risk register that sits behind these gates records line by line.
Skipping a gate does not remove the work, it moves the work to a worse place. As an illustration, assume a line rated at 20,000 boards a week that starts volume production at 70 percent first-pass yield instead of the planned 95, and that each scrapped board carries USD 6 of material and USD 4 of labor and test: the gap is 5,000 boards a week at USD 10, or USD 50,000 a week. If the same gap is found during trial production, it is found at 200 boards a day, where the same 25-point yield gap costs USD 500 a day and can be diagnosed without a customer in the loop.
That arithmetic is why the gate order matters more than the gate schedule. A defect discovered at first article costs an afternoon. The same defect discovered at volume costs the scrap above, plus the containment exercise, plus the credibility of the yield number that was quoted to the customer. The plan is not slow because it has gates; it is fast because each gate is cheap. The failure mode to watch for is a gate that has quietly become a formality, signed by someone who was not present at the evidence review and who has no authority to stop the volume commitment.
Gate |
Question it answers |
Evidence pack |
Signatory |
|---|---|---|---|
Integration |
Does a board travel the whole line without manual intervention? |
Handoff and program transfer records per station |
Equipment or commissioning engineer |
First article |
Does the product meet its acceptance criteria on the first build? |
Print, placement, reflow and inspection results for named boards |
Process owner |
Process window |
Can the line hold the window across a shift, not just a run? |
Control charts or repeated measurements at fixed intervals |
Process owner |
Trial production |
Does yield hold at volume with the real mix? |
First-pass yield, DPPM and downtime log for the trial |
Production lead |
Defect closure |
Are the top failure modes closed rather than contained? |
Pareto with cause, action, verification date |
Quality or process engineer |
Stable output |
Does the line meet the release criteria for consecutive periods? |
Yield, throughput and downtime across the stated window |
Plant or operations manager |
Integration is finished when the line behaves like a single machine rather than a row of machines that happen to be next to each other. That means a board enters at one end and exits at the other without anyone lifting it, every station knows the board is coming, and a stop at any station produces a controlled response upstream and downstream rather than a pile-up. Most integration failures are not software failures; they are mismatches at the boundaries — a conveyor height that is two millimeters off, a handshake signal that uses the wrong polarity, a program that references a product name the next station has never heard of. The work is unglamorous and it is the foundation for every later gate.
The mechanical check starts at the transfer points rather than at the machines. At each handoff, the sending and receiving conveyors must agree on height, edge clearance and the position of the board when the transfer signal fires, and the agreement has to hold under load rather than only when the line is empty. A transfer that works when a single board is present but jams when three are queued is a sensor placement problem, and it will appear on the first day of trial production if it is not found during integration. The same applies to the SMEMA handshake: the signals must be wired consistently along the line so that a stop condition propagates in the direction the operators expect.
Boards that are wide, thin or oddly shaped expose handoff problems that standard test boards hide. A thin panel can sag between conveyors and catch on the leading edge of the next machine; a heavy assembly can lose registration when the belt stops abruptly; a panel with components near the edge can foul a guide rail that was set for a narrower board. Running the widest and thinnest board in the product mix through every handoff, at full speed and at the slowest speed, is the cheapest way to find these before the line is handed to production.
Every station holds a recipe, and the recipes have to agree about the product. The printer holds a print program, the mounters hold placement programs, the oven holds a profile, the inspection stations hold reference images and limits, and the traceability layer holds a product definition that ties them together. Integration is complete when selecting one product at the line level produces the correct program at every station without a person walking down the line changing files by hand. Where that does not exist, the line is not integrated, it is co-located, and every changeover becomes an opportunity for a mismatch.
The failure that hurts most is the silent one: a program that loads, runs and produces boards to slightly the wrong revision. Version control is the defense, and it needs a rule rather than good intentions — one master copy, a naming convention that carries the revision, and a change log that records who changed what and why. The ownership of those records across supplier and customer systems is exactly the kind of boundary that goes unowned by default, and it is worth writing into the project paperwork using which party signs each interface during handover before the first program is loaded.
An integration record is a short document per station, and it should be possible to reconstruct the state of the line from it a year later. For each station it should list the program name and revision, the product it was proven with, the parameters that were changed from the default, the tests performed at the handoff upstream and downstream, and the name of the person who signed. Photographs of sensor positions and guide rail settings are worth including, because a setting that took an hour to find will be lost the first time the rail is adjusted for another product.
The record also needs a punch list with a state, not just an item. Integration generates dozens of small findings — a sensor that needs moving, a guard that fouls a cable, a light that is too dim for the camera — and if they are tracked as conversation they will be forgotten. A three-state list with an owner and a date works here exactly as it does elsewhere: closed with evidence, conditionally closed with a date, or open. The gate passes when the open list is empty, not when the closed list is long.

The first article is the only gate that produces a physical part rather than a record, and it is the gate most often softened because everyone wants the line to be working. Softening it is expensive. A first article that passes because the criteria were vague, or because the failing features were explained away as cosmetic, hands the next two gates a product that has never been judged against a specification. The purpose of the gate is not to demonstrate that the line can make something; it is to demonstrate that the line can make the right thing, reproducibly, with the evidence written down. That requires acceptance criteria that exist before the build starts.
Acceptance criteria should be written against the product's own specification, not against what the line happens to produce. For a printed and placed assembly that usually means a print volume window per aperture class, a placement offset limit per component family, a reflow profile inside the window the paste and components allow, and an inspection result expressed in defects per million opportunities rather than in "looks good". The specific numbers belong to your product and your customer's standard, and they should be agreed before the first board is built rather than negotiated afterwards with the board in hand.
Large-format products change the logistics of the gate even when the process is identical. A panel that needs a carrier, a special magazine or two people to handle it cannot be re-run casually, so the first article has to be planned like a small production event: boards staged, carrier prepared, inspection equipment set up, and everybody who needs to observe in the room at the same time. On an end-to-end line built for large smart-panel boards, the handling step is often the source of the first defect rather than the process itself, which is another reason to define acceptance for the whole flow and not only for the printed board.
The data from a first article is more useful as a distribution than as a verdict. Three boards that all pass tell you the process is inside the window; they do not tell you how close to the edge it is. Measuring the same feature on several boards, and at several positions on each board, produces a spread, and the spread is what predicts whether the process will hold at volume. A print volume that averages inside the window but ranges across most of it will fail on a different paste lot; a placement offset that averages zero but drifts across the board will fail at the panel edges.
The practical output is a short table of feature, target, measured range and margin to the limit. Anything with less than about a third of the window left as margin is worth a conversation before trial production, because volume conditions — a warmer afternoon, a paste lot with slightly different viscosity, a feeder that indexes a little slower — will eat margin faster than they will move an average. Recording the margin also makes the next gate easier to judge, since trial production can be compared against the same features rather than against a general impression.
A first article should be repeated whenever a variable that affects the result changes materially: a new paste lot, a new stencil, a program revision that alters placement or profile, a supplier change on a critical component, or a repair to a machine that involves a mechanical adjustment. It should also be repeated after any change to the board itself, including a panel redesign that alters the position of parts relative to the conveyor. The rule is that the gate certifies a combination, not a product, and any change to the combination invalidates the certificate.
The judgement call is what counts as material. A pragmatic test is whether the change could move a measured feature by more than ten percent of its allowed tolerance. A paste lot change can; a change of operator cannot, provided both operators are certified. Writing the rule down with that test attached stops the two opposite failures — repeating the first article for trivial reasons until nobody takes it seriously, and skipping it for a change that quietly alters the process. The second failure is the one that shows up as an unexplained yield drop three weeks into volume.
First-article check |
What the record shows |
How to read it |
|---|---|---|
Print volume and area |
Per-aperture result on several boards and positions |
Range and margin matter more than the average |
Placement offset |
Offset by component family, including board edges |
Drift across the board predicts edge failures |
Reflow profile |
Measured profile against the allowed window |
Confirm it on the product, not on a test coupon |
Inspection result |
Defects per million opportunities, by type |
Type distribution points at the station to fix |
Handling and carriers |
Marks, scratches, edge damage after the run |
Damage here is a flow problem, not a process one |
Traceability |
Board identifier retrievable with its process data |
If it cannot be retrieved, the run is not evidence |
A process window is not the range of settings that produced a good board once. It is the range the line can return to, shift after shift, with the people and materials it actually has. The distinction matters because the window found during a first article is usually wider than the window that survives production: it was found by an engineer, on one paste lot, in a quiet hall, with the same operator watching every board. Turning it into something a line can hold means choosing a center point with margin on both sides, documenting the parameters that must not be touched, and putting the measured output on a chart so that drift is visible before it becomes scrap. This is the stage where a PCBA factory production ramp up plan stops describing intent and starts constraining behavior.
Printing is the station where the window is easiest to get wrong, because squeegee pressure, speed and separation speed interact rather than add. Raising pressure to clear a stubborn aperture also drives paste under the stencil and increases the cleaning burden; slowing separation improves release on fine apertures and reduces throughput on everything. The useful approach is to fix a target for print volume, then change one parameter at a time and record the result, until the combinations that hold the target across the whole board are known. Two or three combinations usually qualify, and the one chosen should be the one that is most forgiving of the variables nobody controls.
What makes a combination forgiving is worth stating explicitly. A setting that sits in the middle of its tested range, that produces the same volume at slightly different speeds, and that does not depend on a particular operator's technique will survive a paste lot change better than one that is tuned to a single point. The same logic applies to the stencil: tension, aperture finish and the number of prints since cleaning all drift, and a window that assumes a fresh stencil will fail quietly as the stencil ages. Which stations define the window set is determined earlier, by the process sequence rather than by the equipment list, and that dependency is described in how the process route decides which stations have to be brought under control first.
A profile belongs to a product, not to an oven. The same oven running a heavy board and a thin board needs different profiles, and a line that keeps one profile for everything is trading yield on both. The profile should be measured on the product with a profiler that travels the conveyor, not inferred from the oven display, and the measurement should be repeated when the thermal mass of the assembly changes — a heat sink, a large connector, a change of layer count. The window itself comes from the paste specification and the component ratings together, and the tighter of the two governs.
Two habits make profiles survive production. The first is recording the profile by name and revision alongside the program that uses it, so that a program change cannot silently leave the old profile behind. The second is re-profiling on a schedule rather than only after a fault, because heating elements age and a profile that was inside the window when installed can drift toward the edge over months. Neither habit is expensive; both are routinely skipped, and the resulting failures look like paste problems until somebody measures the profile.
A window becomes a control system when the output is measured at a fixed interval and plotted against limits that sit inside the window. For printing, that is print volume on a sample of boards per shift; for placement, it is offset on a sample of boards per program run; for reflow, it is a periodic profile check plus the oven's own zone readings. The limits should be tighter than the specification, because the point of the chart is to act before the specification is breached, and the reaction to a point outside the limit should be written down in advance — who is called, what is checked first, and what production does while it is being checked.
The chart also produces the evidence the next gate needs. A trial production run that shows a stable chart for a full shift is a much stronger statement than a run that ended with a good final inspection, because it demonstrates control rather than luck. If no chart exists, the honest position is that the window is known but not controlled, and the ramp plan should say so rather than pretend the first article covered it. Control is a separate accomplishment from capability, and volume production needs both.
Volume changes the conditions the window was found under. Paste sits on the stencil longer between prints, the oven runs continuously instead of warming up for a run, feeders index thousands of times more often, and the people running the line are not the people who set it up. Each of those is a small shift in a variable, and the window that survives them is narrower than the one measured during the first article. Estimating that narrowing in advance is not possible with precision, which is why the plan uses margin rather than prediction: a center point with room on both sides absorbs the shift, a center point at the edge does not.
The practical rule is to prefer the setting that is slightly slower and clearly stable over the setting that is faster and near a limit, at least until the line has run a full week. Throughput recovered later is cheap; a yield problem embedded in a released process is expensive to remove, because every change to a released process needs its own verification. This is one of the few places in a ramp where the conservative choice is also the faster one over a quarter, and it is worth saying out loud in the gate meeting so that the decision is recorded rather than reversed by pressure later.

Trial production is where the plan stops being an engineering exercise and starts competing with the rest of the plant for people, material and attention. The purpose is not to make as many boards as possible; it is to find the failure modes that only appear when the line runs for hours with the real mix. A single-shift trial will surface queueing, replenishment, changeover and consumable exhaustion — the four things that never appear in a first article and always appear in the first week of volume. The gate passes when the yield and the downtime log both meet stated conditions, not when the shift ends without a crisis. Trial production also assumes that the building, the utilities and the material kit are already closed items, which is the set of conditions covered by the readiness items that have to be closed before the first trial run.
A structure that works is three runs of increasing size, each with its own question. The first is a short run of around ten boards, aimed at confirming that the line produces the same result it produced during the first article now that the setup has been touched by other people. The second is a run of around a hundred boards, long enough to include a feeder replenishment, a stencil wipe cycle and a shift change, and aimed at finding the interruptions that a short run hides. The third is a full shift at planned rate, aimed at measuring yield, throughput and downtime under production conditions.
Each run should end with a decision rather than a report: continue, repeat, or stop and fix. Repeating a run is normal and should not be treated as a failure of the plan; a hundred-board run that exposes a replenishment problem has done its job. What should not happen is a full shift being used to discover a problem that ten boards would have shown, which is why the order is fixed and the volume increases only after the previous question is answered. The cost of a repeated short run is hours; the cost of a failed shift is a day and a half of confidence.
The measurements should be the same at every stage so that the trend is visible. First-pass yield, defects per million opportunities by type, throughput against planned rate, and downtime with a reason code. Recording them at each run produces a curve rather than a snapshot, and the curve is what a customer or an auditor will ask for when the ramp is reviewed. A single number at the end of the trial answers the question "did it work", which is not the question the gate is asking.
Downtime deserves its own discipline because it is the measurement most often kept as a narrative. A reason code list of ten to fifteen entries, agreed before the trial, turns "the line stopped a lot" into a ranked list of causes with hours attached. That list is the input to the next gate, and it is also the most useful document for the maintenance plan, because the causes that dominate a trial are usually the ones that will dominate the first year. Where the trial runs a mixed product set, the codes should distinguish changeover time from unplanned stop time, or the two will be merged and both will be managed badly.
Some failures only exist at volume, and they are worth naming in advance so that they are recognized rather than debated. Reel exhaustion in the middle of a panel, nozzle clogging that appears after a few thousand placements, paste drying on the stencil during a long print run, conveyor wear that shows up as intermittent misregistration, and inspection false calls that accumulate faster than anyone can review them. None of these can be reproduced with ten boards, and all of them are normal rather than exceptional.
The response to each is a prepared countermeasure rather than an improvisation. A replenishment plan that anticipates reel changes, a nozzle cleaning interval validated against actual clogging, a stencil wipe cycle tied to print count, a spare conveyor belt on the shelf, and an inspection limit review after the first thousand boards. Preparing them before the trial is what makes the difference between a ramp that absorbs volume failures and one that is surprised by them, and the list belongs in the plan next to the gate criteria rather than in a lessons-learned document afterwards.
A trial that runs one product for a shift proves less than it appears to. Most PCBA plants ramp on a mix, and the mix is where changeover time, program errors and feeder swaps live. Including at least one changeover in the trial converts the ramp plan from a single-product exercise into something that survives the second week, and it produces the changeover time that the capacity model needs. A changeover that takes four hours during the trial will not take two hours in volume without a specific project to reduce it.
The mix also tests the material flow. Kits for the next product have to be staged while the current one runs, which needs space, a picking process and a place to put the returned partial reels. None of that is a machine problem, and all of it is invisible in a single-product trial. Running two products back to back during the trial is the cheapest way to find out whether the plant can actually kit a line at the rate the ramp plan assumes, and it usually reveals that the constraint is the warehouse rather than the line.
Trial run |
Size |
Question it answers |
Exit condition |
|---|---|---|---|
Run 1 |
About 10 boards |
Does the line reproduce the first-article result? |
Same features inside the same margins |
Run 2 |
About 100 boards |
What interrupts the line inside one shift? |
Interruptions identified, countermeasures assigned |
Run 3 |
One full shift |
Does yield, rate and downtime meet the plan? |
Stated thresholds met, downtime ranked by cause |
Run 4 |
One shift with a changeover |
Can the plant kit and change over at the planned rate? |
Changeover time measured and accepted |
Every ramp produces a Pareto, and most ramps stop there. A ranked list of defects is a description, not a closure, and the difference between a line that stabilizes in three weeks and one that never does is whether the top five entries each acquire a verified fix. The work has a predictable shape: separate symptoms from causes, assign each cause to the station that can eliminate it, verify the fix with a measurement rather than with an opinion, and only then move to the next entry. It is slow at the start and fast afterwards, because the first few causes usually account for most of the loss. A PCBA factory production ramp up plan that does not include this stage is really only a commissioning schedule with a volume date attached, and it will be rewritten by the first month of production.
Solder bridging is a symptom. It can be caused by print volume, by placement pressure, by reflow profile or by pad design, and a team that treats it as a cause will try remedies in the wrong order and conclude that the process is unstable. The discipline is to keep asking what produced the observation until the answer names a parameter, a material or a design feature. A Pareto sorted by defect name tells you where the pain is; a Pareto sorted by verified cause tells you what to change, and the second one is the only version worth taking to a review meeting.
The fastest route from symptom to cause is usually the measurement the line already makes. Print volume data explains bridging better than a visual inspection, placement offset data explains tombstoning better than a reflow profile, and inspection images classified by position explain opens better than either. Building the habit of pulling the data before the meeting converts a discussion into a lookup, and it also stops the recurring pattern where the same defect is attributed to a different cause each week depending on who is in the room.
A closure loop needs five fields per entry: the defect, the verified cause, the action, the verification date and the name of the person who owns it. The action should name a change to a document, a parameter, a fixture or a material — something that can be inspected later — rather than an intention to monitor. The verification date matters because it is the point at which somebody re-measures and either closes the entry or reopens it with a new cause. Without that date, closure becomes an assertion made at the end of a project.
Ownership should sit with the function that can change the cause, not with the person who found it. A print defect belongs to whoever owns the print process, even if it was found at inspection; a design-driven defect belongs to whoever can change the design, which may be outside the plant entirely. That split is the reason defect closure needs a route for issues the plant cannot fix, and it is worth agreeing in advance how those are escalated, because a ramp can stall for weeks on a cause that only the customer's design team can remove.
Containment is legitimate and it is not the same as giving up. Containing means adding an inspection step, a rework loop or a material substitution that keeps output flowing while the permanent fix is developed, and it is the right choice when the cause is understood but the fix has a long lead time. What makes containment acceptable is that it is written down with an expiry date and a cost, so that it does not quietly become the process. A containment step that has been in place for six months without a review is a permanent cost that nobody decided to accept.
The judgement is roughly economic. As an illustration, assume a defect at 800 DPPM on a line running 5,000 boards a week, with each escape costing USD 40 in rework and administration: that is USD 160 a week, while a full-time inspection station costs several times that. Containment that costs more than the defect it prevents should not be started, and a fix that removes the cause entirely should be preferred even when it takes longer — provided the volume ramp can wait. Writing both numbers down is what turns this from an argument into a decision, and it is also the fastest way to end a discussion about whether the problem is serious. The arithmetic is simpler on a line where every defect passes through a single process block, which is why a short DIP line where the same defect appears at one station usually closes its Pareto faster than a mixed SMT line does.
Closure is not deletion. The entries that were fixed, the entries that were contained and the entries that turned out to be something else altogether all carry information about how this line behaves, and the cheapest moment to capture it is while the people who did the work are still on the project. A short review that records, for each top entry, what it looked like, what the real cause was, and what would have detected it earlier produces a list of early-warning signals that is more valuable than the original Pareto.
The practical output is a page of signals attached to the line's maintenance folder. Examples are a print volume trend over three shifts, a nozzle vacuum reading after a cleaning cycle, a feeder index time that creeps up before it fails. These become the triggers in the routine checks, and they convert a ramp experience into something that the next product on the same line inherits. Without that transfer the plant relearns the same six lessons on the next ramp, which is the most common and least discussed cost of a project that nobody documented.
Stable output is a claim about people as much as about equipment, and it is the only claim in the plan that has to survive after the project team leaves. The line will be run by operators, maintained by technicians and scheduled by a planner, and each of those roles has a competency threshold below which the process degrades regardless of how well it was set up. Certification is the mechanism that makes the threshold visible; a numeric definition of stable output is the mechanism that makes it verifiable. Neither is difficult to create, and both are frequently replaced by a training record and a general sense that things are going well. The last section of a PCBA factory production ramp up plan is therefore the one that decides whether the previous six sections were an achievement or an episode.
A certification means something when it is tied to an observable task and has an expiry. Signing a training attendance sheet certifies attendance. Certifying an operator to set up a print program means watching them do it, checking the result against the window, and recording that they did it without help. The difference matters most at the third shift, where the person making the decisions has the least support and the most freedom to improvise, and where the consequences of an uncertified improvisation appear the next morning as an unexplained yield dip.
Three levels are usually enough. Level one can run the line and respond to the standard alarms. Level two can change a program, adjust a process parameter inside the documented window, and perform the first-line checks. Level three can qualify a new product or a new program, which is a process engineering task and should be held by very few people. Each level needs a practical test, a named assessor and a review interval, and the matrix should be visible on the floor rather than filed, because its purpose is to tell people who to ask at three in the morning.
Stable output needs a definition with numbers, a window and a consequence. A workable form is: first-pass yield at or above a stated level, throughput at or above a stated rate, unplanned downtime below a stated number of hours, and no single defect type above a stated share — measured over a defined number of consecutive production periods, not over a single good day. The numbers should come from the business case rather than from what the line happens to achieve, or the definition will be rewritten to match the result.
The window matters as much as the numbers. One shift of good output is a data point; five consecutive shifts is a trend. The consequence matters too: if the definition is missed, the line returns to a reduced scope or a supported state rather than continuing at volume with a known gap. Writing the consequence in advance is what separates a definition from a wish, and it is the item most often left out of a ramp plan because it is uncomfortable to agree to before the line is running.
Release criterion |
How it is measured |
Typical evidence gap |
|---|---|---|
First-pass yield |
Per shift, by product, from inspection data |
Yield reported after rework |
Throughput |
Boards per hour at planned staffing |
Measured on a single product only |
Unplanned downtime |
Hours per week with reason codes |
Recorded as narrative, not as hours |
Defect concentration |
Share of total defects by type |
No type breakdown, only a total rate |
Process control |
Charts in place with limits and reactions |
Charts exist but nobody acts on them |
Certified staffing |
Number of certified operators per shift |
Certification not tied to a practical test |
Handover is a transfer of ownership, not a presentation. The production lead takes responsibility for output, the maintenance lead for the equipment and its schedule, and the process owner for the windows and the programs; each of those needs the documents that make the responsibility executable, and each needs to have used them at least once before the project team leaves. A handover that consists of a folder and a meeting leaves the new owners discovering the documents for the first time under pressure.
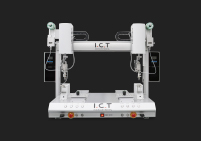
The practical test is to run one full production period with the project team present but silent. If the line meets its criteria with the new owners making the decisions, handover has happened. If it only meets them when somebody from the project steps in, the line has been borrowed rather than handed over, and the ramp plan should record that honestly. On a line with a high degree of manual intervention the test is stricter, because operator pace becomes a throughput variable rather than a constant — which is exactly the situation on a semi-automatic line whose output tracks operator pace, where the certification matrix is effectively part of the capacity model.
The first week after handover is the real test, and it should be planned rather than observed. Two things usually go wrong. The first is that the support that was invisible during the ramp disappears without being replaced — the engineer who answered questions in ten minutes is now on another project, and the answer takes a day. The second is that the informal adjustments made during the ramp, which nobody wrote down, are either lost or applied inconsistently, and the process drifts away from the window within days.
A one-week plan that names a support contact, a daily fifteen-minute review and a rule for who may change a parameter closes both gaps. The daily review does not need to be long; it needs to look at the same four numbers the release criteria use, so that the first sign of drift is caught while it is still a chart and not yet a scrap report. After that week, the line belongs to production, and the ramp plan's last act is to hand over the numbers that prove it.
Send the first-article data before the volume commitment is signed
If a line is at the point where the first article has passed and a volume date is being discussed, the most useful thing to send us is the first-article pack itself: the print and placement results with their ranges, the measured reflow profile against the allowed window, the inspection breakdown by defect type, and the trial production numbers if they exist. We will read them the way the gate is meant to be read — margin to the limits rather than average against the target — and tell you which stages look genuinely closed and which are being carried forward as assumptions. It is a desk review, not a site visit, and it usually takes a few days. What we ask for is deliberately small: one product, one set of measurements, and a note of anything that was contained rather than fixed, so the conversation happens while the ramp can still be adjusted rather than after the volume commitment has been made to a customer.
It depends on the mix and the number of new products, not on the equipment. A single mature product on a line with experienced operators can move from integration to a full shift in two to three weeks. A new product with a first-article cycle, two trial runs and a changeover usually takes four to eight weeks. The plan should be built from the gates rather than from a target date, and the date should follow the gates.
Commissioning proves the equipment works; ramp-up proves the process holds. Commissioning ends when the line runs a board through every station, and it is usually finished within days of installation. Ramp-up ends when yield, rate and downtime meet defined criteria across consecutive production periods with the people who will actually run the line. Many projects sign off the first and report the second as complete without the evidence.
It can, but it proves less than it appears to. A single-product trial leaves changeover time, feeder swaps and material kitting untested, and those are where most of the first month's losses sit. Including at least one changeover in the trial makes the ramp plan survivable into the second week, and it produces a real changeover time for the capacity model instead of an estimate.
Enough to see a spread rather than a single result, which usually means three to five boards measured at several positions each. One board tells you the process can produce a good unit; it does not tell you how close to the window edge that unit was. Measuring the same features across boards and positions is what produces the margin that predicts behaviour at volume.
When the cause is understood, the permanent fix has a long lead time, and the containment cost is lower than the loss it prevents. Containment must carry an expiry date and a recorded cost, otherwise it becomes the process by default. A containment step that has survived six months without review is a permanent cost that nobody decided to accept.
First-pass yield by product, throughput against planned rate, and unplanned downtime in hours with reason codes. Those three cover capability, capacity and reliability, and they are the same numbers the release criteria use, which is what makes the comparison meaningful. Defect type breakdown should be recorded at the same time so the next gate has a starting Pareto rather than a total rate.
The plant or operations manager, with the process owner co-signing the process criteria. The supplier can confirm equipment condition and integration evidence but cannot certify yield, staffing or downtime, because those depend on how the line is run. The signature should be against a fixed evidence pack and a numeric definition of stable output that was agreed before the ramp started.